16. Multiple Variables Quiz
Which Plot Is Best?
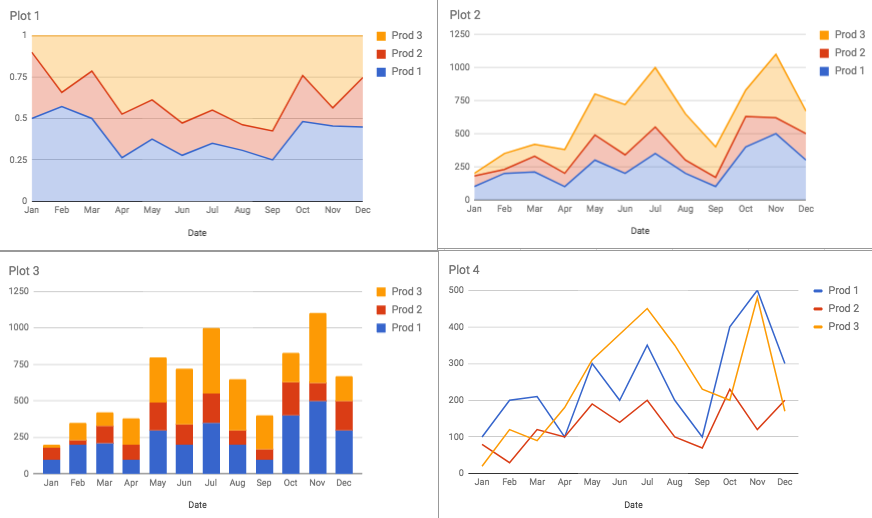
Below the same data are shown in 4 different ways. You can download the data by clicking the button below. You can also access the data in a Google Sheet here. Use the below plots to answer the following quiz questions.
Notice, that there isn't one plot that is best for all questions. We really need to show the data in a way that the insight is easy for your audience to see it. Depending on the insight you are trying to highlight, you may choose a different way to display the data.
